How often have you opened a trade on a level breakout and then had the price reverse against you? Fake breakouts happen quite often and are a problem for many traders who buy at highs and sell at lows.
Trading on a breakout is a fairly popular and viable trading strategy. However, some breakouts often turn out to be fake. This can be quite frustrating, not to mention that it can often lead to a losing trade.
However, in many cases, an experienced trader can analyze the market situation and react appropriately. Fake breakouts can be profitable if you know how to trade them correctly.
Contents
What is a fake breakdown?
A fake breakout is a price fixing above or below a level with a subsequent reversal. In other words, the market lacks a sufficient number of buyers or sellers who can support the price movement in the direction of the breakout.
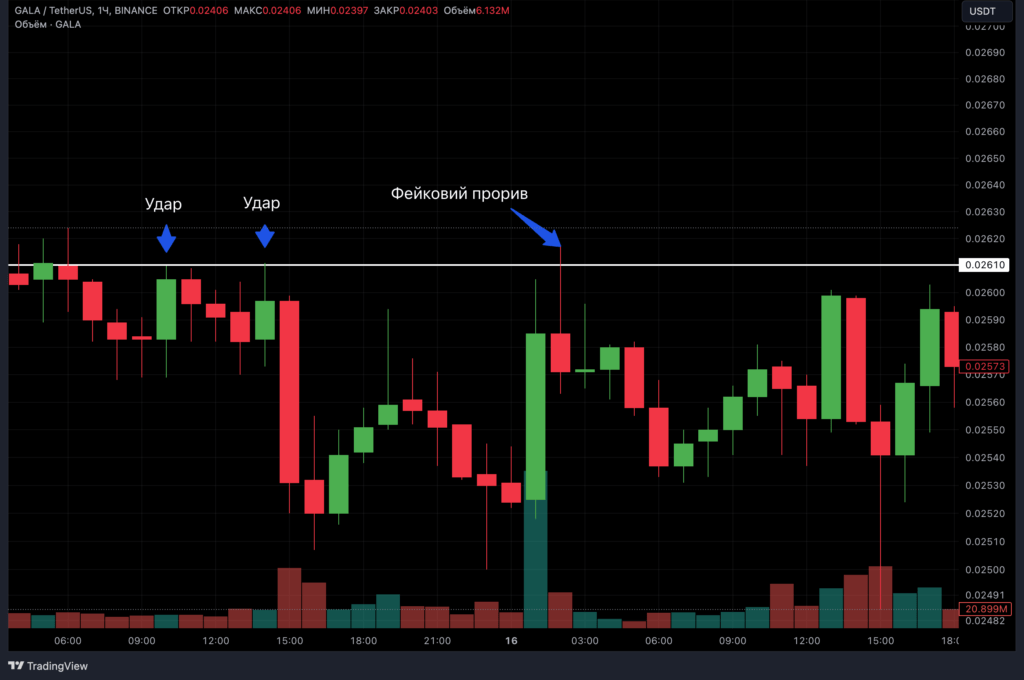
Fake breakout of the horizontal level:
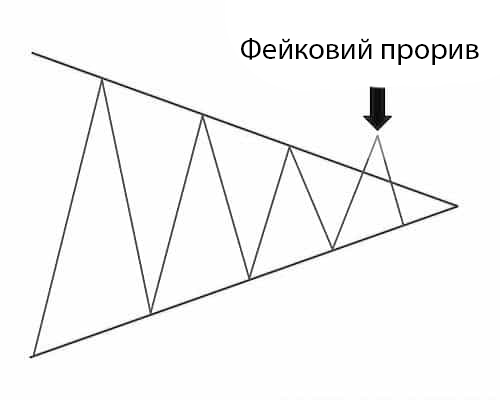
Fake breakout of a triangle pattern:
After the breakout, the market failed to maintain sufficient bullish momentum to keep the price above the level. In other words, the market did not have enough demand to continue moving up after the breakout.
A fake breakout is a situation where the price crosses an obvious level but then suddenly changes direction. When the initial breakout of a level occurs, many traders open a trade in the direction of the breakout. These traders get trapped when the price reverses, causing their stop losses to be triggered. New traders also enter the market, which puts additional pressure on the price. Often, this causes the price to change into a new trend that is opposite to the initial breakout.
A fake breakout and a new price direction:
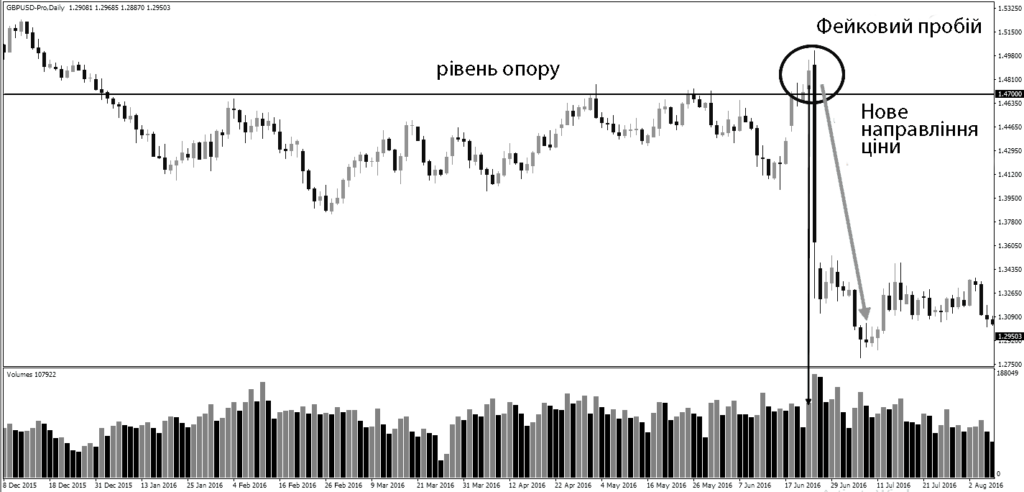
On the chart above, you can see something similar to a head and shoulders pattern. We can see a breakout of the neckline, but then the price suddenly reverses and falls down.
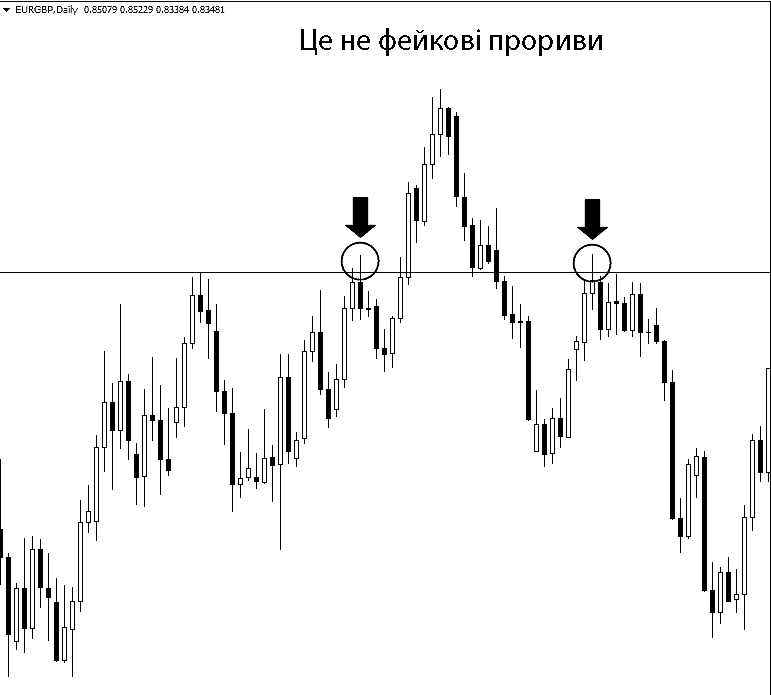
Note that the price must first close above the level. If a candlestick simply breaks a key level with its shadow, this formation cannot be considered a fake breakout. In the chart below, there was no fake breakout at the marked places because the candlestick failed to close above the key level. That is, a real breakout of the level must first occur.
This is not a fake breakdown:
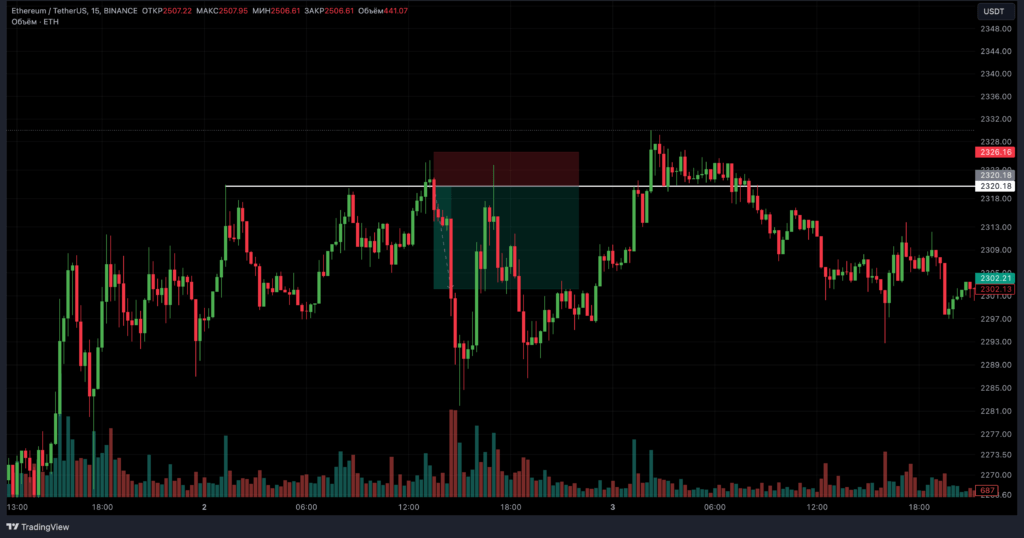
The chosen timeframe is of primary importance for a trading strategy with fake breakouts. If we were trading on a 15-minute chart, the decision on whether this formation is a fake breakout would be made differently. There is too much price noise on younger timeframes to adequately assess what is a fake breakout and what is not.
A breakout that turns out to be fake indicates strength in a downtrend or weakness in an uptrend. In fact, any pin bar on the higher timeframe is a fake breakout on the lower one.
As you can see, a fake breakout can easily cause significant losses for any trader trading on a breakout.
In fact, some traders develop their entire strategy around trading fake price action as it can be a very powerful approach to trading. Some of the best trades happen when market participants get trapped and their stop losses start to kick in.
How to find patterns of fake breaches?
If you don’t learn how to correctly identify fake breakouts, you won’t be able to trade them successfully. For example, sometimes there are situations when the price goes back to the breakout point and then continues its movement.
One way to detect fake breakouts is to follow the volume. Real breakouts are usually accompanied by strong trading volume at the time of the breakout. If this volume is absent, there is a higher probability that the breakout will not occur.
So, if the trading volume is low or decreases during a breakout, a fake breakout is likely to occur. On the contrary, if the volume is high or increasing, a real breakout is likely.

Above, you can see an example of a breakout that occurs in a bullish trend. We have a volume indicator added at the bottom of the chart. Note that the Volume indicator shows an increase in trading volume during the breakout.

The above example is a fake breakout at the 1.4700 resistance level. On the fourth test of the level, the price closes above the level, which was not the case on the previous tests. Many traders will now open long positions.
In this case, however, the volume indicator does not provide us with much information. However, the direction of the price changes dramatically.
It is also useful to keep an eye not only on the trading volume, but also on the price movement on the lower timeframe. In many cases, you will see that the price makes a very sharp retreat on the younger timeframe, which is not obviously observed on the older timeframe.
The trap of a fake breakdown
Have you ever entered the market believing in a breakout with the expectation that the price will rise? After all, many trading guides state that a breakout can be considered confirmed when a candle closes above a resistance level. However, the price moves in your direction for a while and then abruptly changes 180 degrees. As a result, your stop loss is triggered.
A fake breakout is exactly what is called a fake breakout bull trap. Buyers are trapped because the price started moving against their positions and they are now in the red.
A fake breakout involves several candles, usually 1-4, that go beyond a key support or resistance level. Such breakouts occur after a strong movement because the market has reached an important level, but the price momentum is still strong.
How can you avoid this trap? There are two tips:
- Don’t try to catch up with the price.
- Use the accumulation of positions by large players.
Don’t try to catch up with the price
Many traders are tempted to open a trade when they see a rapid price movement on large bullish candlesticks. However, more often than not, a reversal occurs. Why? Because there is no support to hold the price. This means that the market can easily reverse in the opposite direction to the nearest level.
Use position accumulation by big players
Which breakout entry technique is the most reliable? Wait for the position to be accumulated by the big players. On the chart, you should see a tight consolidation of the price near the level. It should be so tight that the candlesticks are trapped in a narrow range.

What does position accumulation give us?
- Good risk to return ratio.
- We will have a logical place to set a stop loss (below the accumulation minimum), and a potential breakout will allow us to make a significant profit.
- A sign of strength. When a position accumulates near a resistance level, it indicates strength. This means that buyers are willing to buy at higher prices even near the resistance level.
- An opportunity to profit from losing traders. Many traders place limit orders from the resistance level, placing their stops just below the level. The longer the price fluctuates near the level, the more traders will enter shorts. However, if a breakout occurs, these traders’ stops will be immediately triggered. This will give a strong impetus to the price to move in the direction of the breakout.
How to trade a fake breakout?
Now that we’ve learned how to avoid the trap of fake breakdowns, it’s time to capitalize on them.
To do this, we need:
- Find a strong price movement to the level (the larger the candle size, the better).
- Wait for the level to break (traders who trade on the breakdown are trapped).
- During a false breakout (preferably on a large candlestick), place a stop loss order.
The stop loss can be set at a distance of 1 ATR from the resistance level. In this way, we will give the price some breathing room and our stop will not be accidentally hit.
In many cases, the stop-loss order will be placed relatively close to your entry point, which will allow you to get a very attractive risk-to-reward ratio.
There is no specific target for setting take profit when trading false positives. You should try to hold your trade for the entire impulse movement. If you notice a decrease in volume, the price movement may be exhausted, and it may be advisable to close the trade and take profit. In addition, never forget to keep an eye on the nearest support and resistance levels.
A great way to set a take profit when trading false breakouts is to use a trailing stop, which can be pulled up at the highs of each previous candle. However, it is also ideal to stick to the 1 to 3 strategy when we can take profit from the market with the size of 3 stops, or having received a stop, lose the risk much less than the profit.
You can also set the take profit at the nearest level or move it under the rollback limit.
Summarizing the results
- A false breakout occurs when the price rebounds from a key level.
- When the price closes above a level and then starts moving sharply in the opposite direction. This causes many traders to be trapped on the wrong side of the market and increases the momentum of the movement in the opposite direction from the breakout.
- Паттерн ложного пробою може стати вигідною можливістю для входу на ринок при ретесті ціни до рівня.
- One way to distinguish false breakouts from real ones is to use a volume indicator.
- Breakdowns with low or decreasing volume are more likely to be false.
- with a high or increasing volume are more likely to be real.
- Use price action and consider the overall market context when making decisions about opening positions.
No similar records found...